Monthly Trend Board: Roll Daily Metrics Into Longer Term Performance Signals
Daily safety and quality data feeds a monthly Trend board so recurring problems become visible over time.
- Creator
 Northwestern Michigan College
- Company
- Hayes Manufacturing
- Wastes
Daily issues such as minor injuries and non-conforming parts waiting for action can look isolated when they stay on a local board only.
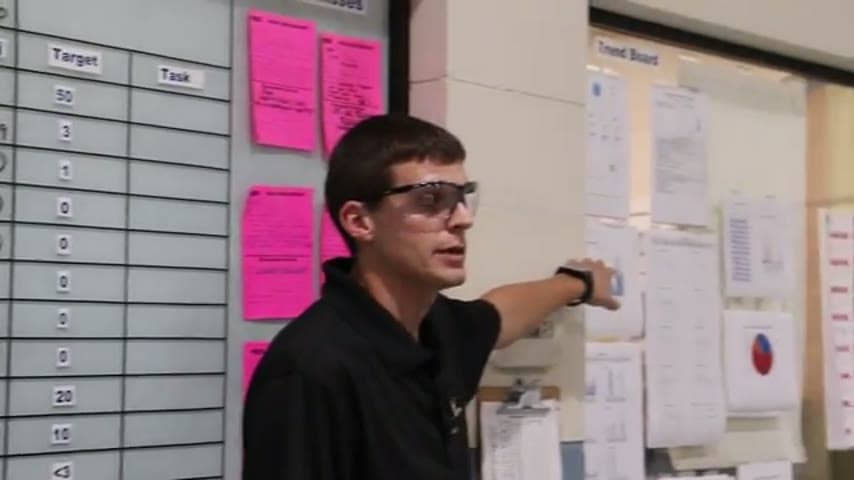
The team tracks daily metrics, including Band-Aid usage, Tylenol usage, and non-conforming parts waiting to be addressed. That data is populated monthly on a Trend board, then flows to a run the business board for quarterly management review.
Make daily knowledge visible and reusable for longer term decisions.
What is a Monthly Trend Board?
A monthly Trend board is a visual management board that turns daily metric entries into a longer term view. Instead of treating each day as a separate event, the board shows whether safety and quality problems are recurring.
In this example, the daily source data includes Band-Aid usage, Tylenol usage, and non-conforming parts waiting to be addressed. The same data is then populated monthly on the Trend board.
The Trend board becomes a reusable knowledge source for the next review level. Information flows from the monthly board to a run the business board, where management reviews it quarterly using the same visible facts.
Why it works
The board converts daily observations into reusable knowledge that adds value to review and helps prevent repeated misses.
- Knowledge reuse: daily facts are not lost after the day, they are carried forward into a monthly record.
- Added value: the team can see whether injuries, defects, and waiting items are part of a larger pattern that needs action.
- Mistake-proofing: using the same source metrics reduces the chance that known problems are missed or reinterpreted differently at each review level.
- Alignment: the monthly Trend board creates a clear handoff from local metrics to quarterly management review.
Evidence: The transcript states that the data goes to a Trend board populated monthly, then goes up to a run the business board for quarterly management review.
How to create this idea
- 1Choose daily metrics
Select the few measures that reveal recurring risk, such as minor injuries and non-conforming parts waiting for action.
- 2Define each count
Make each metric unambiguous. For example, define what counts as a non-conforming part waiting to be addressed.
- 3Record at the source
Capture the data where the work happens so the daily record reflects actual activity, not delayed memory.
- 4Roll up monthly
Transfer the daily data to a monthly Trend board. Keep the format consistent so each month can be compared.
- 5Review the pattern
Look for repeated problems, rising counts, or missing follow-up. Use the trend to select countermeasures.
- 6Escalate the same facts
Feed the monthly Trend board into the run the business board so management reviews the same data quarterly.
Best used when
- daily metrics exist
- recurring defects
- minor injuries
- waiting for action
- management review
Less useful when
- one-time events
- unclear metrics
- no review cadence
- untrusted data
Tags
- Problem
- defectswaitinghidden trendssafety issues
- Lean methods
- visual managementdaily managementtrend analysismistake proofing
- Application
- qualitysafetyoperationsmanagement review
Captured from Northwestern Michigan College at Hayes Manufacturing in the video "Lean Management Systems: Visual Management at Hayes Manufacturing", at 00:09:14. On Lean Toolbox. Watch the original video on YouTube ↗